AI Coding Workflow
This guide summarizes a practical workflow for xLLM developers who need to optimize NPU serving, debug regressions, or prepare pull requests with reproducible evidence.
The workflow is maintained as a separate knowledge base at xllm-workflow. Use that repository when you want copy-ready agent skills, prompt templates, artifact schemas, and reusable model optimization history.
When to use it
Section titled “When to use it”Use this workflow when a change needs evidence beyond a normal code review:
- optimizing TTFT, TPOT, TPS, memory usage, or serving concurrency;
- comparing xLLM with vLLM-Ascend, SGLang NPU, or another serving framework;
- debugging garbled output, dataset score drops, GPU/NPU mismatches, OOM, graph replay failures, HCCL issues, or runtime crashes;
- validating an NPU-related PR before it is merged;
- deciding whether an operator migration or kernel-level experiment is needed.
Do not treat one smoke run as a formal conclusion. Formal performance and accuracy claims should include the exact command, environment, workload, raw artifacts, and normalized summaries.
Evidence loop
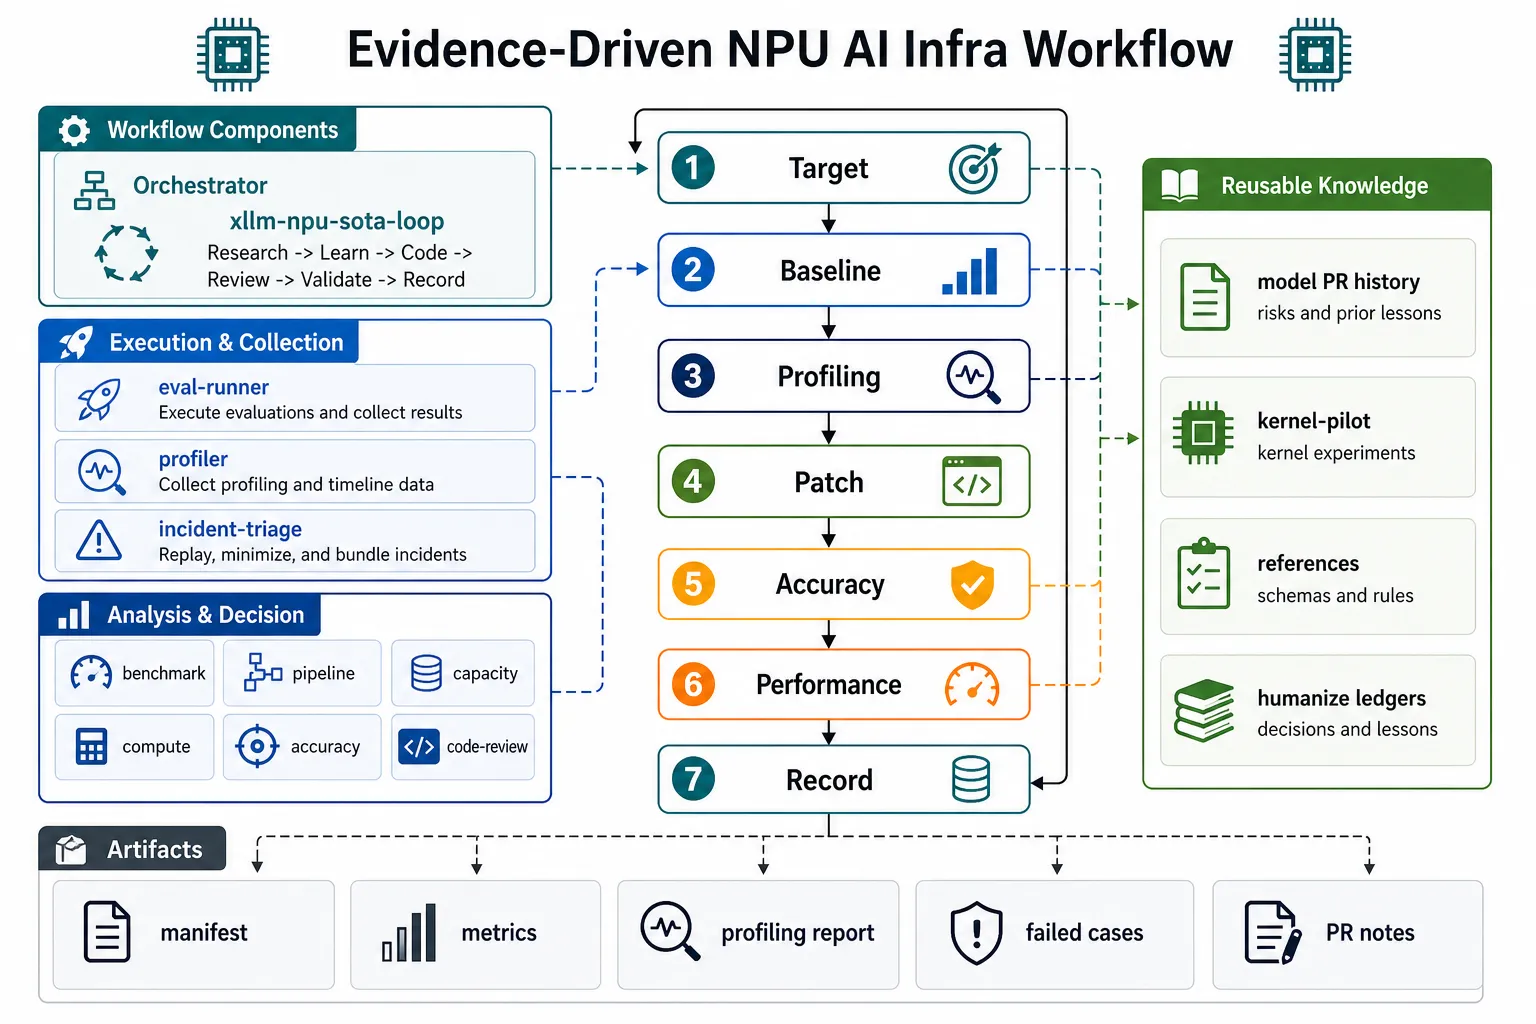
Section titled “Evidence loop”For performance and correctness-sensitive work, follow this loop:
target -> baseline -> profiling -> patch -> accuracy -> performance -> recordThe key rule is to keep benchmark, profiling, and accuracy evidence separate. Profiling explains bottlenecks, but it does not replace warmed-up before/after performance measurements.
Use these phases for a complete optimization task:
| Phase | Purpose | Output |
|---|---|---|
| Target and environment | Define the goal, model, framework commit, hardware, CANN/runtime versions, workload, and SLA. | Run manifest |
| Historical knowledge | Check prior model PRs, failed attempts, and known risky paths. | History notes |
| Fair baseline | Run warmed-up baseline tests before code or parameter changes. | Raw metrics and summary |
| Evidence collection | Collect profiling, capacity, pipeline, compute, or accuracy evidence based on the symptom. | Diagnostic report |
| Patch | Make one meaningful, reviewable change per round whenever practical. | Code diff |
| Validate | Re-run accuracy, performance, build, and UT checks appropriate to the change. | Validation table |
| Record | Preserve commands, metrics, failed attempts, risk notes, and follow-up work. | Reusable lesson |
Developer checklist
Section titled “Developer checklist”Before opening or updating an NPU optimization PR, make sure the PR description can answer these questions:
- What model, tokenizer, dtype, device type, device count, and framework commit were used?
- What exact startup command and benchmark command were used?
- Was the baseline warmed up and run on clean devices?
- Are profiling results used only as diagnostic evidence?
- Which accuracy level was run, and where are failed cases stored if any?
- What changed in the patch, and what risk remains?
- Which artifacts can another developer use to replay the conclusion?
Recommended artifacts
Section titled “Recommended artifacts”For formal results, keep these artifacts together under the same run root:
manifest.mdormanifest.yamlwith environment and command details;- raw evalscope or benchmark output;
- normalized
metrics.jsonorsummary.md; - profiling report and timeline notes when profiling is used;
failed_cases.jsonlor equivalent bad-case records for accuracy work;- PR notes that summarize what changed, why it is safe, and how it was validated.
The workflow repository provides shared schemas for these artifacts:
references/run-manifest-template.mdreferences/perf-artifact-schema.mdreferences/profiling-artifact-schema.mdreferences/accuracy-artifact-schema.md
Related skills
Section titled “Related skills”The workflow repository includes task-oriented skills that can be loaded by Codex, Claude Code, opencode, or another local agent runtime:
| Task | Skill |
|---|---|
| End-to-end optimization | xllm-npu-sota-loop |
| Service startup and evalscope collection | xllm-npu-eval-runner |
| Fair framework comparison | xllm-npu-benchmark |
| msprof / MindStudio analysis | xllm-npu-profiler |
| Decode bubble and rank-skew analysis | xllm-npu-pipeline-analysis |
| HBM, KV cache, and OOM analysis | xllm-npu-capacity-planner |
| FLOPs, MFU, and lower-bound estimates | xllm-npu-compute-simulation |
| Accuracy regression debugging | xllm-npu-accuracy-debug |
| Crash or runtime incident triage | xllm-npu-incident-triage |
| NPU code review | xllm-npu-code-review |
| Operator migration | xllm-npu-op-migration |
These skills are aids for disciplined engineering. The final judgment still depends on reproducible xLLM artifacts and reviewable code changes.